
WMAP Facts
WMAP is collecting high-quality science data in its L2 orbit. The science team has produced the most detailed version a full sky map of the faint anisotropy or variations in the temperature of the cosmic microwave background radiation. An overview of the Results is on this site. Or actual data is available on the LAMBDA Archive site for study and analysis.
WMAP Mission Background
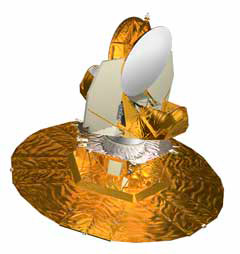 The WMAP Observatory has a back-to-back
optical system that provides for differential measurements of the sky. The upper portion, above the white cylinder, is
passively cooled by the large vertical radiator plates. The bottom shield protects against the strong microwaves from the Sun
and Earth.
The WMAP Observatory has a back-to-back
optical system that provides for differential measurements of the sky. The upper portion, above the white cylinder, is
passively cooled by the large vertical radiator plates. The bottom shield protects against the strong microwaves from the Sun
and Earth.
The WMAP (then MAP) mission was proposed to NASA in 1995 and selected in April 1996 as a MIDEX mission administered by the Explorers Program. The WMAP Team proposed a predominantly non-redundant spacecraft with a lean mission operations and data analysis approach.
WMAP was launched on June 30, 2001 from the Cape Canaveral Air Force Base aboard a Delta II rocket. In September 2002 WMAP completed its first full year of science observations at L2. In February 2003 the WMAP Team released a set of 13 papers (241 journal pages) along with flight data from the first year of observations of the CMB.
WMAP completed its prime 2 years of mission operations in its L2 orbit by September 2003. Meanwhile, the Astronomy and Physics Senior Review granted WMAP mission extensions, ultimately endorsing 9 years of mission operations, to end September 2010.
In March 2006, the WMAP Team released 3-year data, including full polarization data, and papers describing the data processing, systematic error analyses, calibration, and other critical aspects of the experiment. In March 2008, the WMAP Team released 5-year data, with a more detailed look at the data and its scientific implications for the universe.
L2 orbit is a First
WMAP is the first mission to use an L2 orbit as its permanent observing station. L2 is a semi-stable region of gravity that is about four times further than the Moon, following the Earth around the Sun.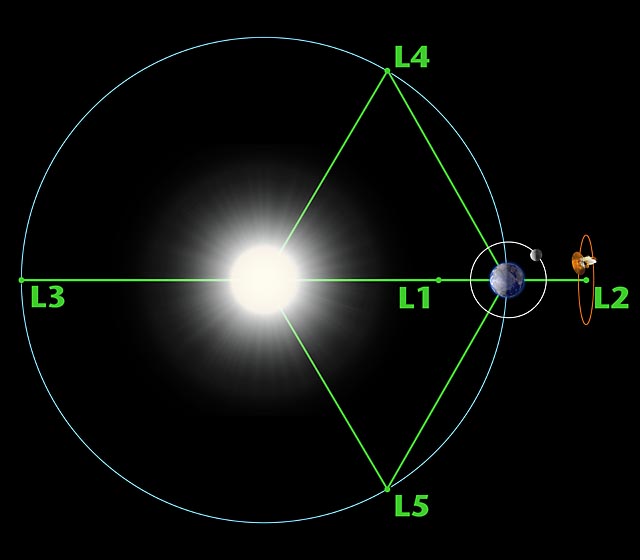
Click on the image for a larger version.
Six Month "Exposure"
Each WMAP observation of the full sky requires a six month period. WMAP orbits L2 in an oval pattern every six months, and requires occasional station keeping maneuvers (usually about every three months) to remain in position.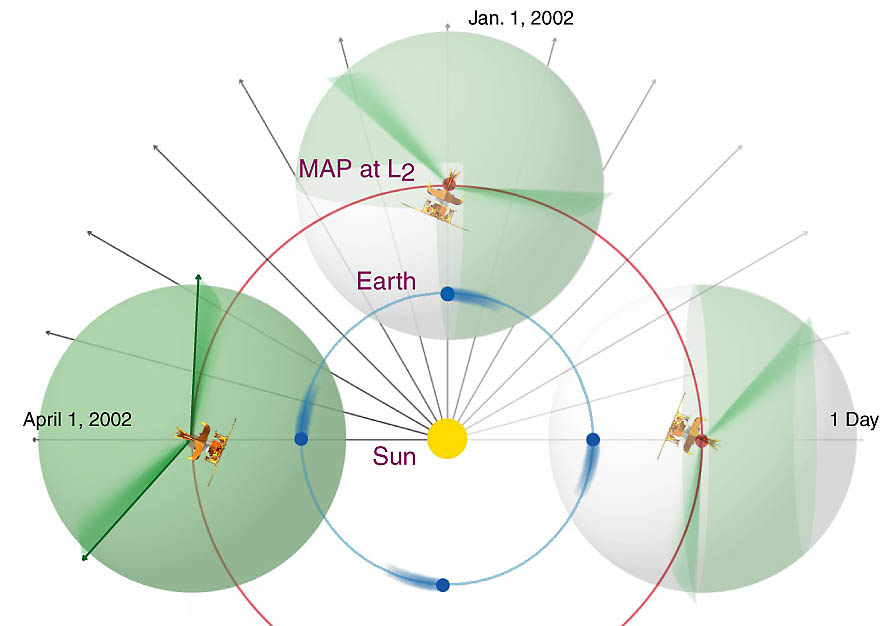
Click on the image for a larger version.
This orbit diagram shows the process by which WMAP collects data from the full sky over a six month period. Because WMAP must always face away from the sun, it can not view all portions of the sky until it rotates around the sun at the same rate as the Earth.
Mission Length
WMAP is currently scheduled to observe for nine years at L2. At this point, all systems continue to function very well.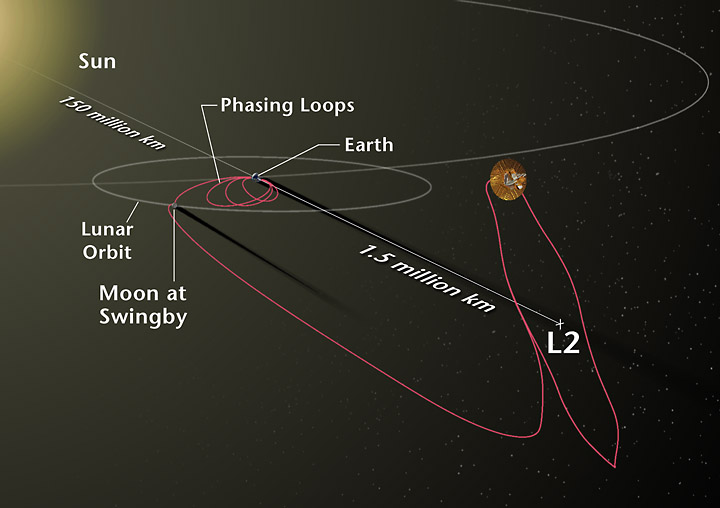
Click on the image for a larger version.
This diagram shows the WMAP trajectory and orbit pattern around the second Lagrange Point (L2). The travel time to L2 for WMAP was 3 months, including a month of phasing loops around the Earth to allow a lunar gravity-assisted boost.
Several animations of the trip to L2 may be found in our Image Gallery.