CMB Images
Images > CMB Images > Five Year Temperature Maps
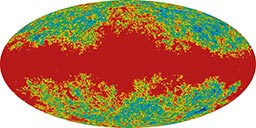
 K band
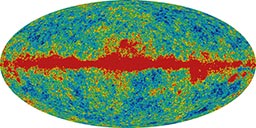
  Ka band
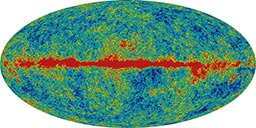
 Q band
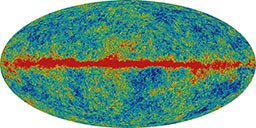
  V band
  W band
 WMAP full-sky maps in each of 5 frequency bands from 23 to 94 GHz.
The red band in each is microwave emission from our Galaxy. The Galactic signal is strongest at 23 GHz, weakest at 61 and 94 GHz. This multi-frequency data is used to subtract the Galactic signal and produce the CMB map shown above.These images show a temperature range of ± 200 microKelvin. The larger versions have a scale included.
Credit: NASA / WMAP Science Team
Available formats:
K band
256 x 128 JPG (14 KB)
512 x 256 JPG(56 KB)
1024 x 512 PNG (210 KB)
2048 x 1024 PNG (801 KB)
Ka band
256 x 128 JPG (15 KB)
512 x 256 JPG(80 KB)
1024 x 512 PNG (309 KB)
2048 x 1024 PNG (1.17 MB)
Q band
256 x 128 JPG (16 KB)
512 x 256 JPG(88 KB)
1024 x 512 PNG (371 KB)
2048 x 1024 PNG (1.42 MB)
V band
256 x 128 JPG (15 KB)
512 x 256 JPG(95 KB)
1024 x 512 PNG (371 KB)
2048 x 1024 PNG (1.42 MB)
W band
256 x 128 JPG (15 KB)
512 x 256 JPG(95 KB)
1024 x 512 PNG (370 KB)
2048 x 1024 PNG (1.41 MB)
WMAP # 081015
